What is the Point?!?! Understanding the Test Point
While doing some planning and getting some inspiration from some of the fantastic bloggers out there, I came across Kate Nowak's post on her f(t) blog.
Currently, I am evolving my teaching to provide students with deeper understanding of why we do things rather than following a process or algorithm. This can provide refreshing and invigorating activities or explanations (which sometimes pushes how I and other were taught when they were in school).
This is my new way of teaching the purpose and reason for a Test Point when Solving Systems of Inequalities with Two Varibales.
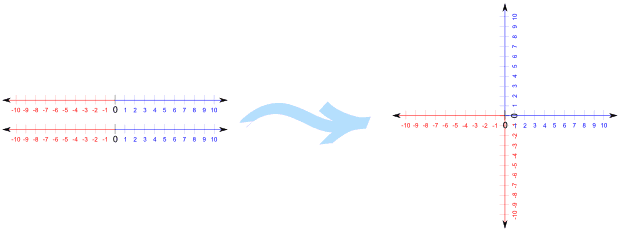
Firstly, we started with connecting back to our previous lesson on combined inequalities. Getting students thinking about combining the x scale and another variable scale, say y, at the same time…TA DA!
So now we are looking at combinations of values of x and y's in two dimensions. The first activity is to look at the meaning of a test point and why we use it and the idea of the boundary.
I put this slide up on the board and demonstrated how can we check if a coordinate is a solution to the inequality by checking if it produces a true or false statement.
I had preprepared some coordinate cards to give students clarity and direction (blank ones here). It also meant that there was a good chance that they should see a pattern emerging! The color of each card matched the inequality graph on the slide. The cards were separated amongst student and got them to place them to place their solutions on the graph.

I asked the students to use the routine "See Think Wonder". Where students just verbalize and connect with what they see, what do they think (is there a pattern? etc) and what do they wonder (will this always work? Is there a short cut? etc). I should of taken a photo of the end product (!) - but that didn't occur to me at the time in class!
It was a great class discussion which really gave purpose to the reason we shade and use a test point - especially once the line (or boundary) was draw in on each graph. Students soon found errors with some solutions their peers had drawn on the board and were comfortable with the idea we can use a test point on either side to tell us our solution!! Success!!!! :)
It was a great way to get them comfortable with what was their solution should now look like and into the process of sketching inequalities.
A fun YouTube clip for shading is "Shade It" a parody on Metro Stations "Shake It"
Currently, I am evolving my teaching to provide students with deeper understanding of why we do things rather than following a process or algorithm. This can provide refreshing and invigorating activities or explanations (which sometimes pushes how I and other were taught when they were in school).
This is my new way of teaching the purpose and reason for a Test Point when Solving Systems of Inequalities with Two Varibales.
Firstly, we started with connecting back to our previous lesson on combined inequalities. Getting students thinking about combining the x scale and another variable scale, say y, at the same time…TA DA!
So now we are looking at combinations of values of x and y's in two dimensions. The first activity is to look at the meaning of a test point and why we use it and the idea of the boundary.
I put this slide up on the board and demonstrated how can we check if a coordinate is a solution to the inequality by checking if it produces a true or false statement.
I had preprepared some coordinate cards to give students clarity and direction (blank ones here). It also meant that there was a good chance that they should see a pattern emerging! The color of each card matched the inequality graph on the slide. The cards were separated amongst student and got them to place them to place their solutions on the graph.

I asked the students to use the routine "See Think Wonder". Where students just verbalize and connect with what they see, what do they think (is there a pattern? etc) and what do they wonder (will this always work? Is there a short cut? etc). I should of taken a photo of the end product (!) - but that didn't occur to me at the time in class!
It was a great class discussion which really gave purpose to the reason we shade and use a test point - especially once the line (or boundary) was draw in on each graph. Students soon found errors with some solutions their peers had drawn on the board and were comfortable with the idea we can use a test point on either side to tell us our solution!! Success!!!! :)
It was a great way to get them comfortable with what was their solution should now look like and into the process of sketching inequalities.
A fun YouTube clip for shading is "Shade It" a parody on Metro Stations "Shake It"
Graphing Inequalities can be printed from here (credit: )
And since it was so hard finding coordinate cards - I have made my own for future use!


Comments
Post a Comment